
-
Get Started
-
Website
-
Embeddables
-
Courses
-
Bundles
-
Batch
-
Code
-
Product Settings
-
Product Pricing
-
Mock test
-
Test Series
-
Ebooks
-
Podcasts
-
Webinars
-
Digital Products
-
Free Resource
-
Telegram
-
Learner Management
-
Quiz & Assessment
-
Content
-
Question Pool
-
Test Evaluation
-
Reports
-
Marketing
-
Forms
-
Workflows
-
CTA
-
Campaign
-
Integrations
-
Roles and Permissions
-
School Settings
-
Sub School
-
Ratings and Reviews
-
Learner Discussion
-
Mobile Apps
-
Reports (Old)
-
Intergrations
-
Zoom integration
-
Newsfeed
-
Payments
-
FAQs
-
Troubleshooting
-
Support
-
Content Security
-
Legacy Website Builder
-
Gamification
How to merge 2 different section-wise reports in a single master sheet
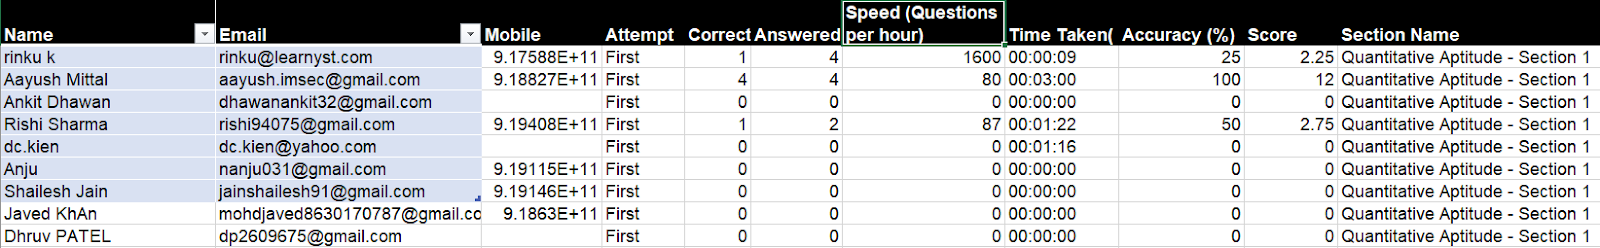
Previously, we had discussed how to download a section-wise test report from your admin dashboard.
That report was in the below format
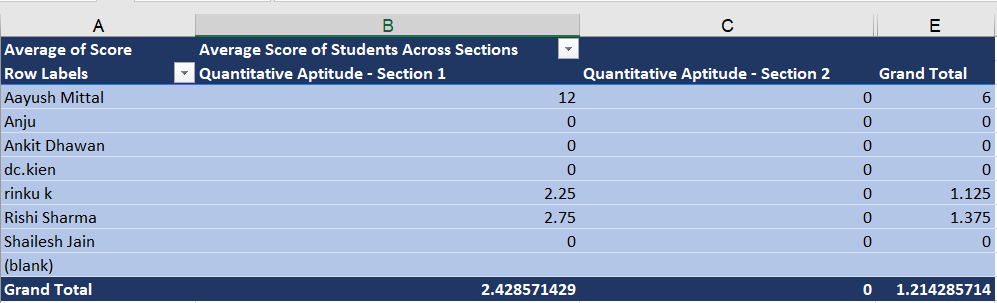
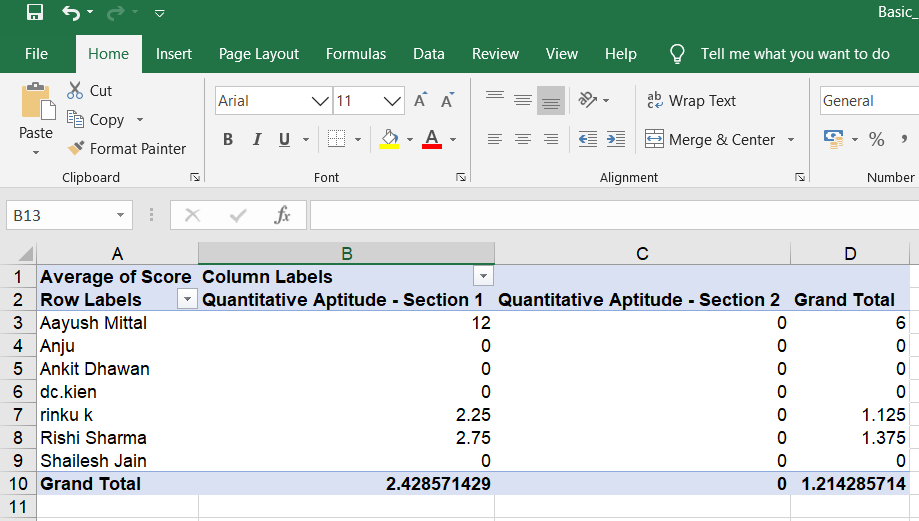
But, what if you wanted a report that shows the average score of your students across all sections like the one below?
You can do this using a pivot table function. If you don’t know how to, let us see how we can do it.
First, download the section-wise reports from the admin dashboard. Check the post on how to download the section-wise report to know how to do this.
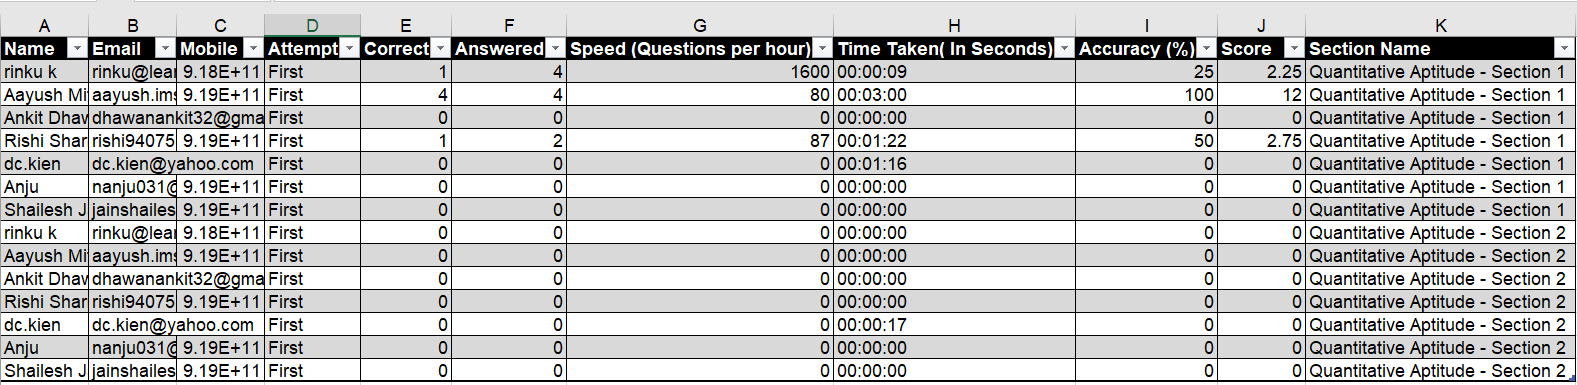
Combine the data from your section-wise reports into a single excel sheet. (Let us name it as a master report)
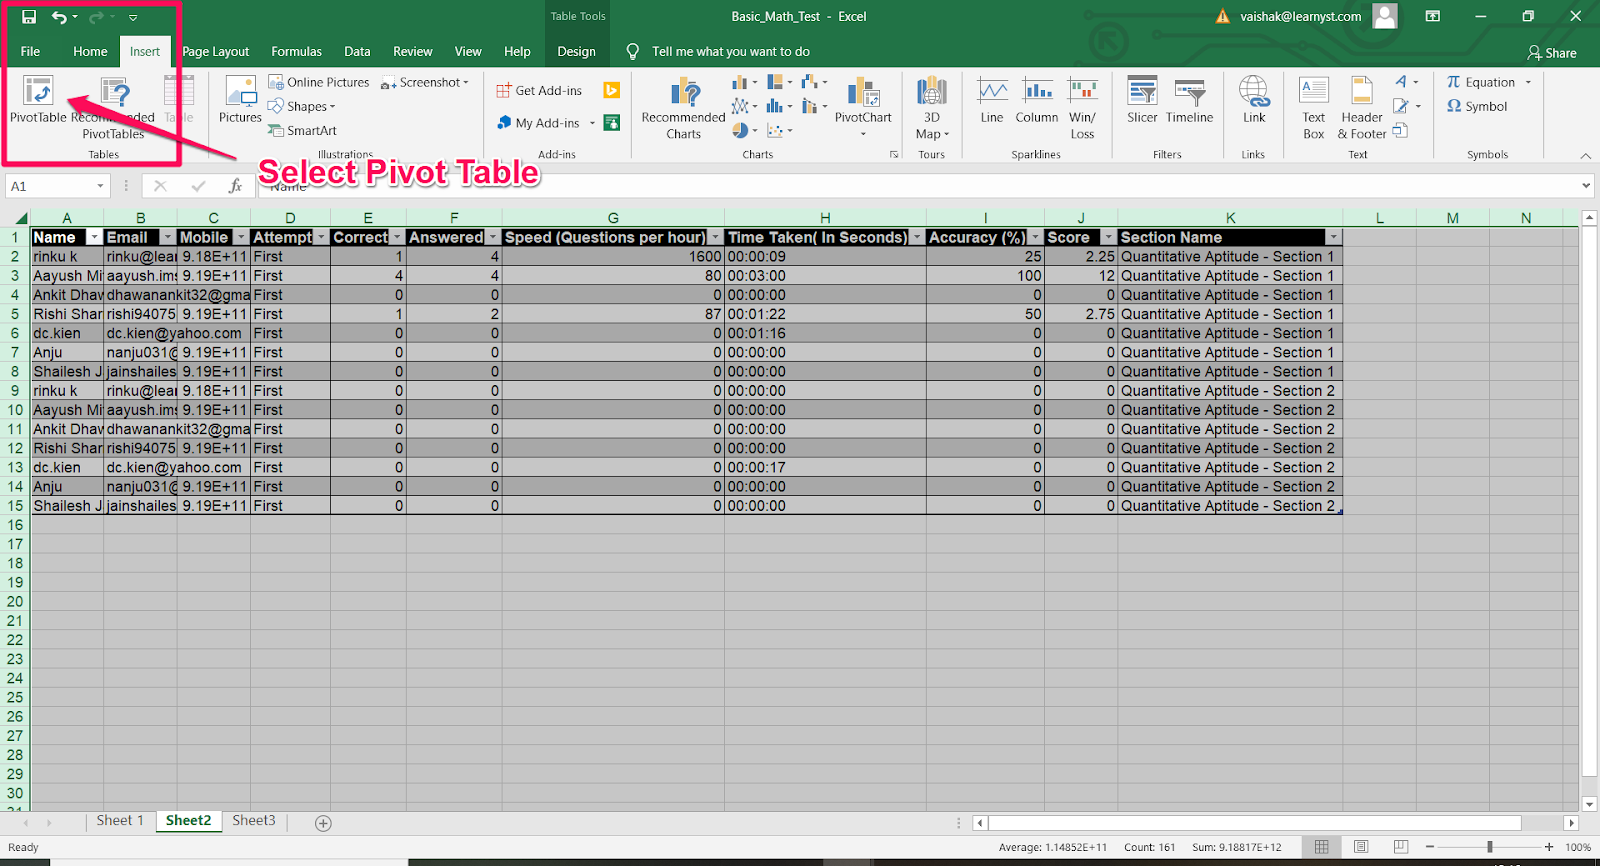
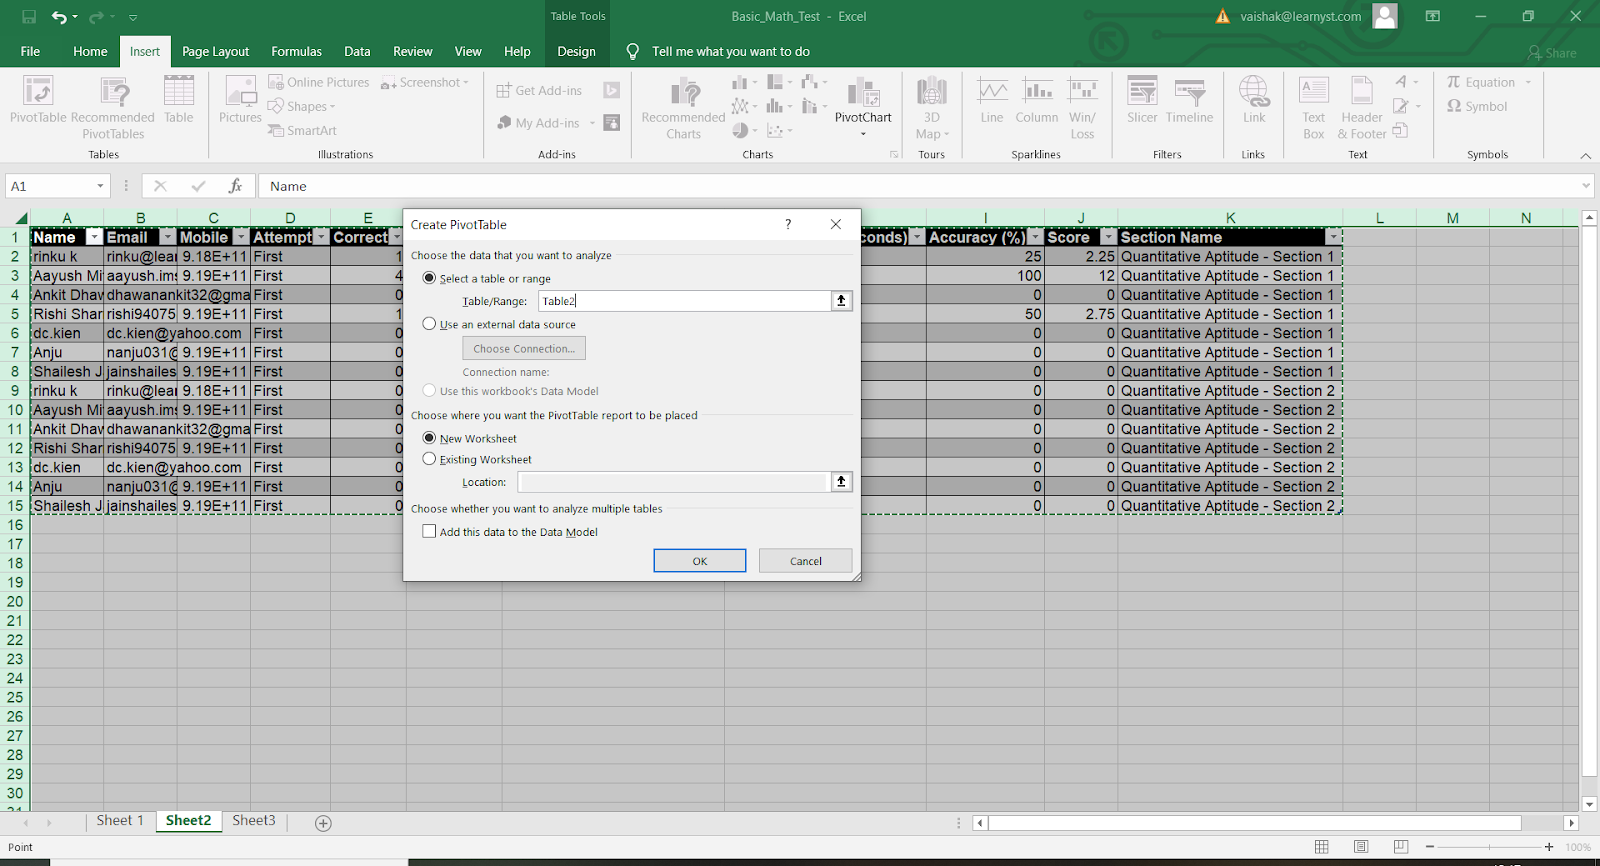
Press Control+a to select the entire sheet. Now, click the Insert option and select Pivot Table
Select the table within the pivot table
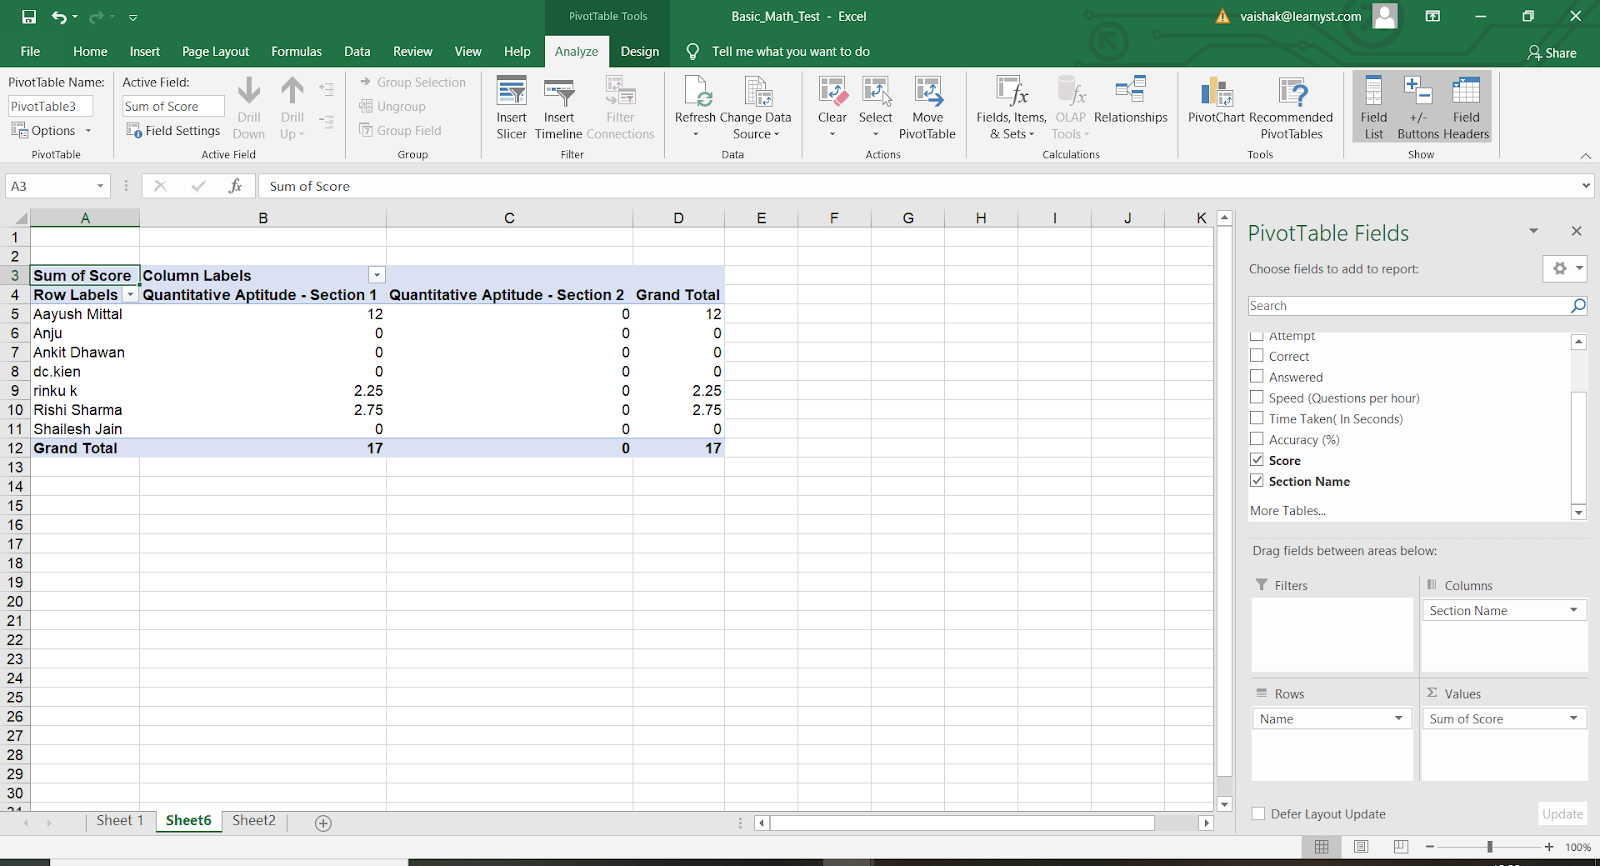
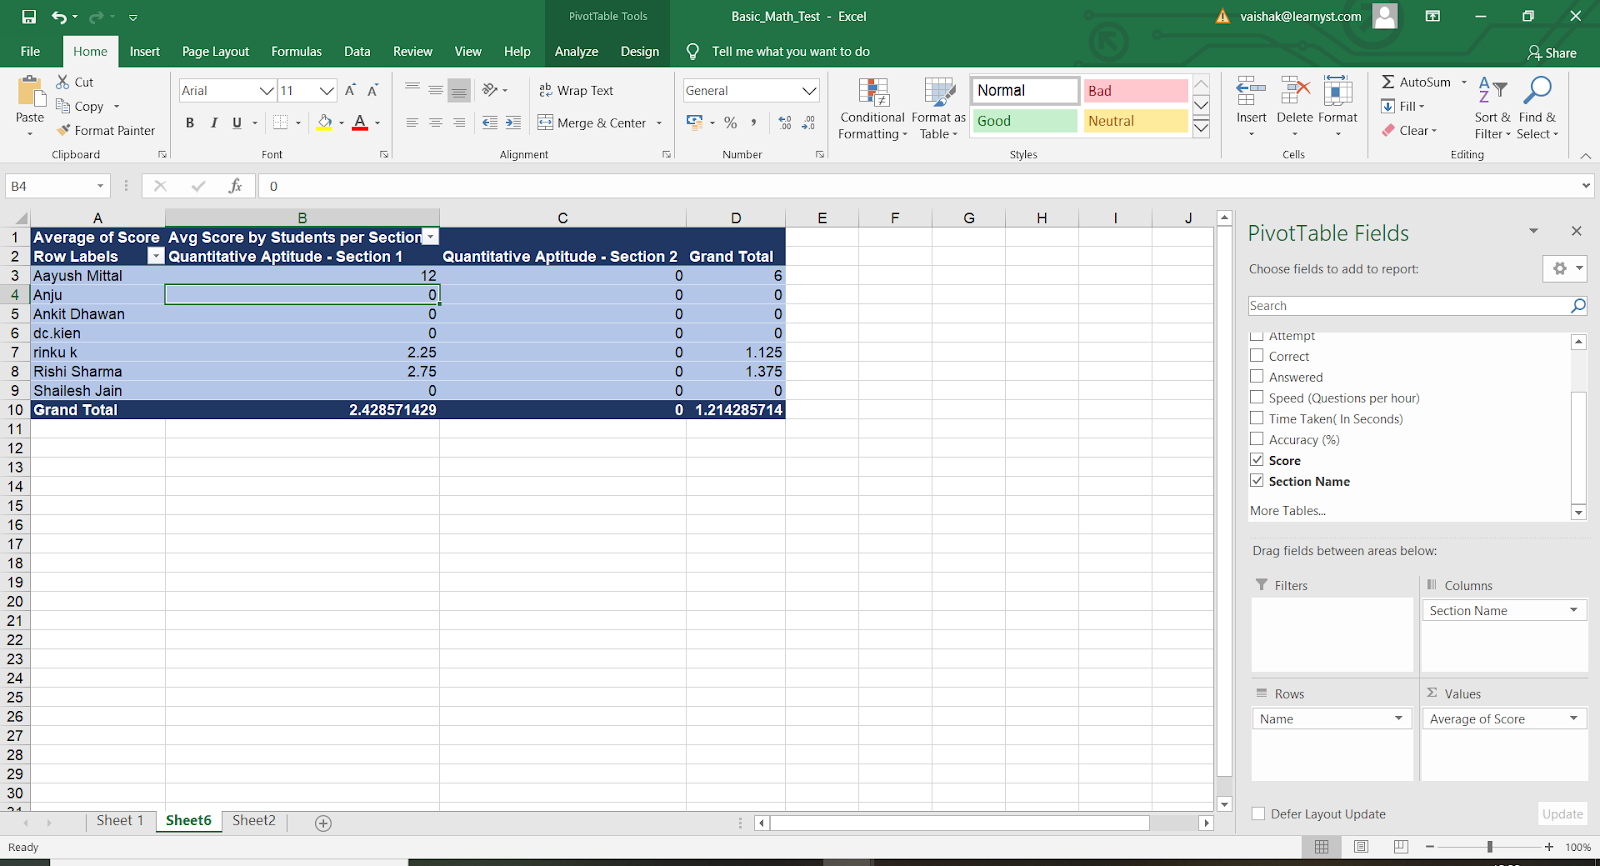
Inside the pivot table, drag and drop the following into the quadrants on the right side
-
Name - Drag it into ROWS section
-
Section Name - Drag it into the Columns section
-
Score (Or any value that you want to see) - Drag it into the Values section
Name - Drag it into ROWS section
Section Name - Drag it into the Columns section
Score (Or any value that you want to see) - Drag it into the Values section
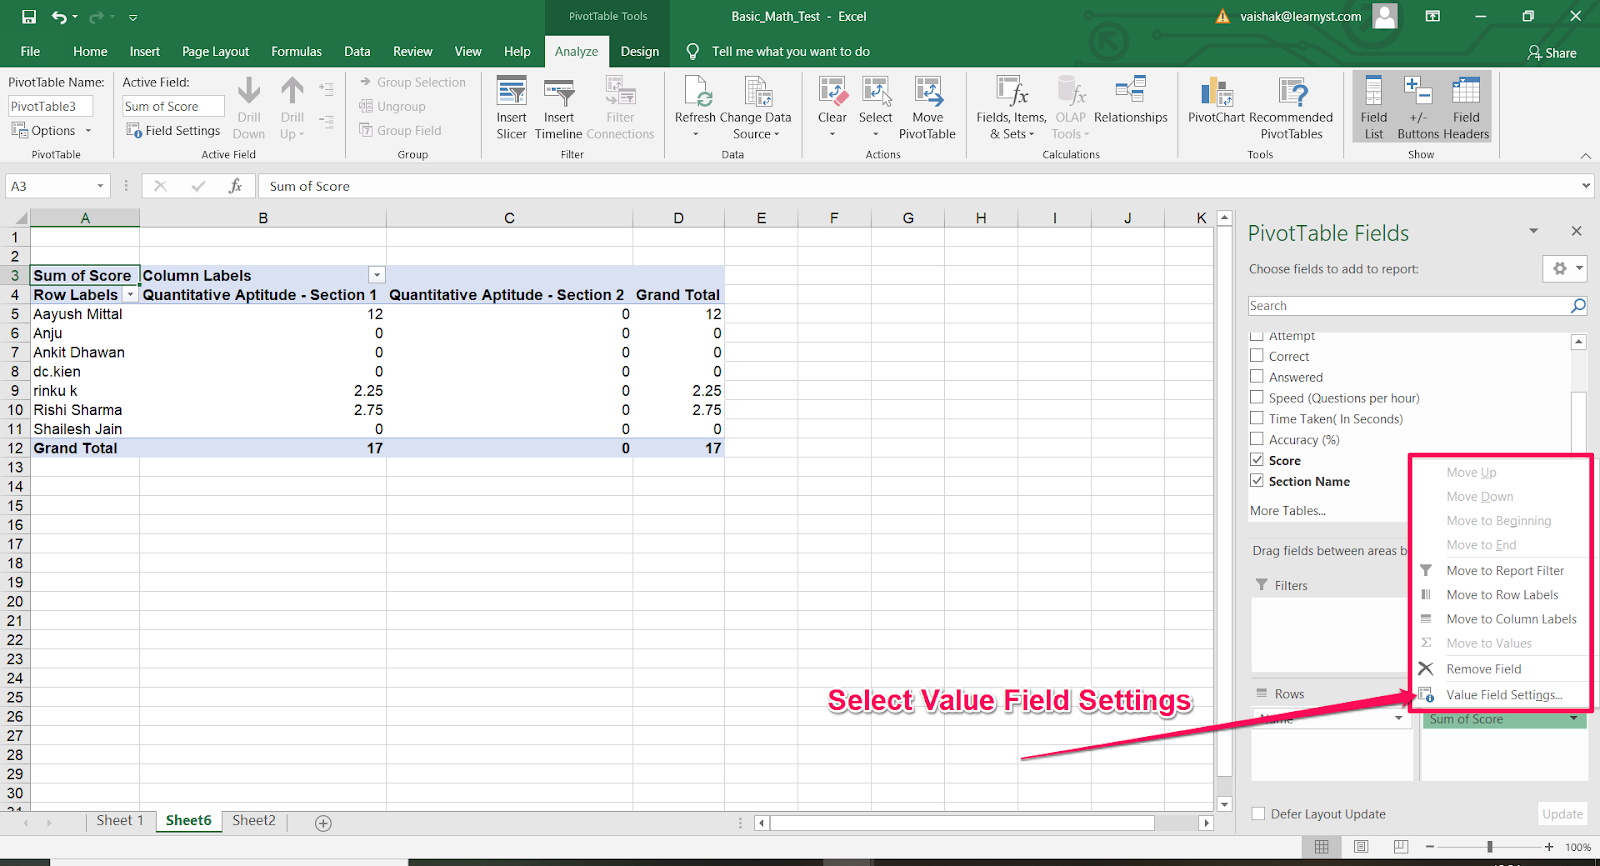
To view the average scores, Go to the values section, select the pointer in the Sum of Scores.
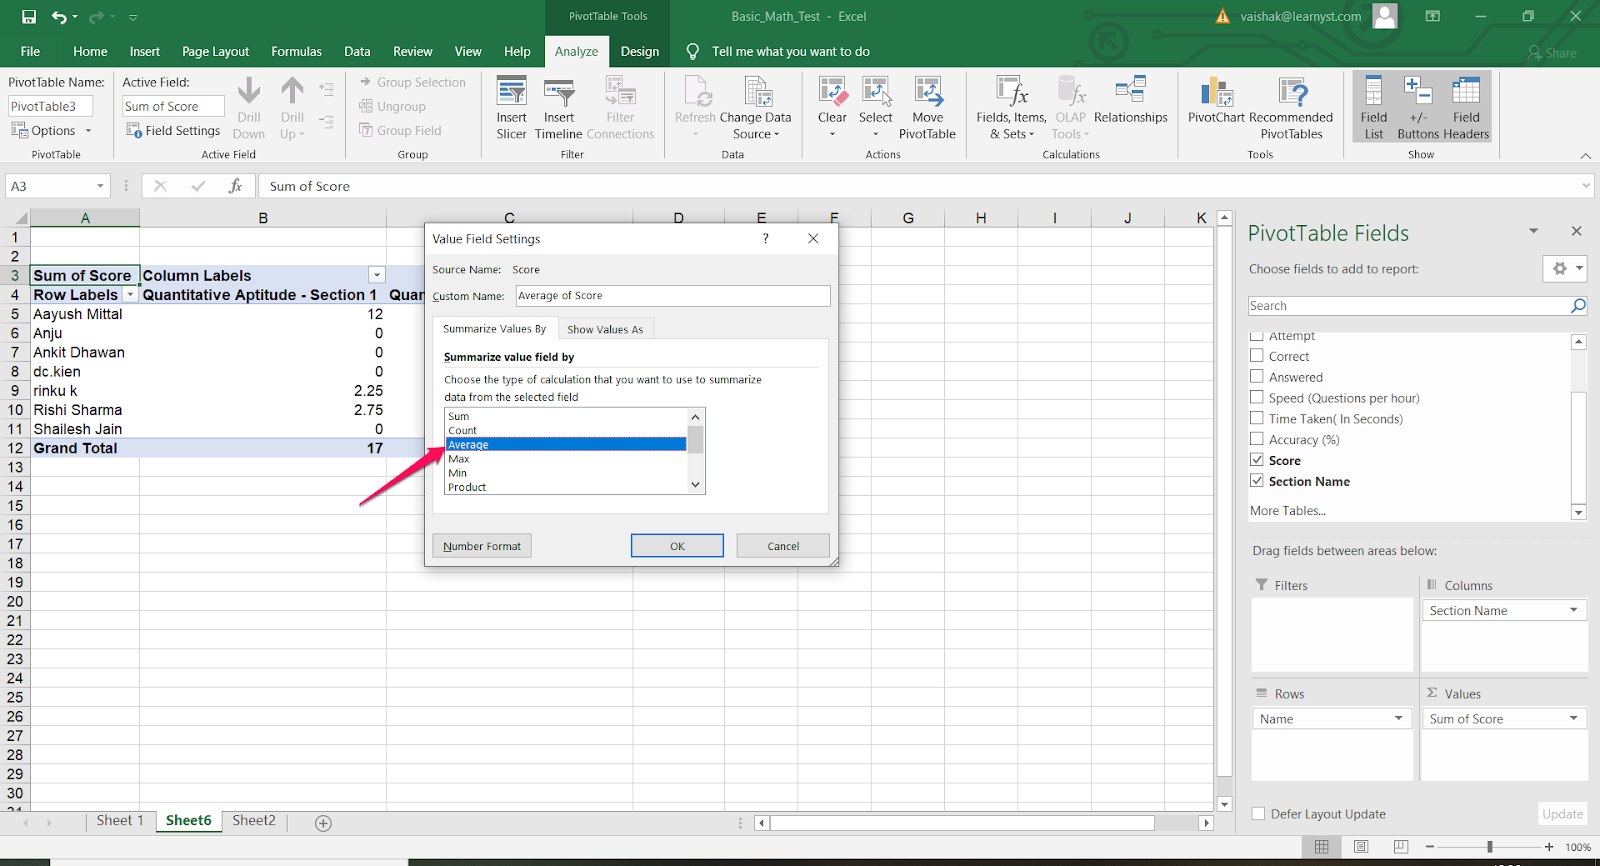
Change the sum to average
Now you have a report that has the values and sections you are looking for
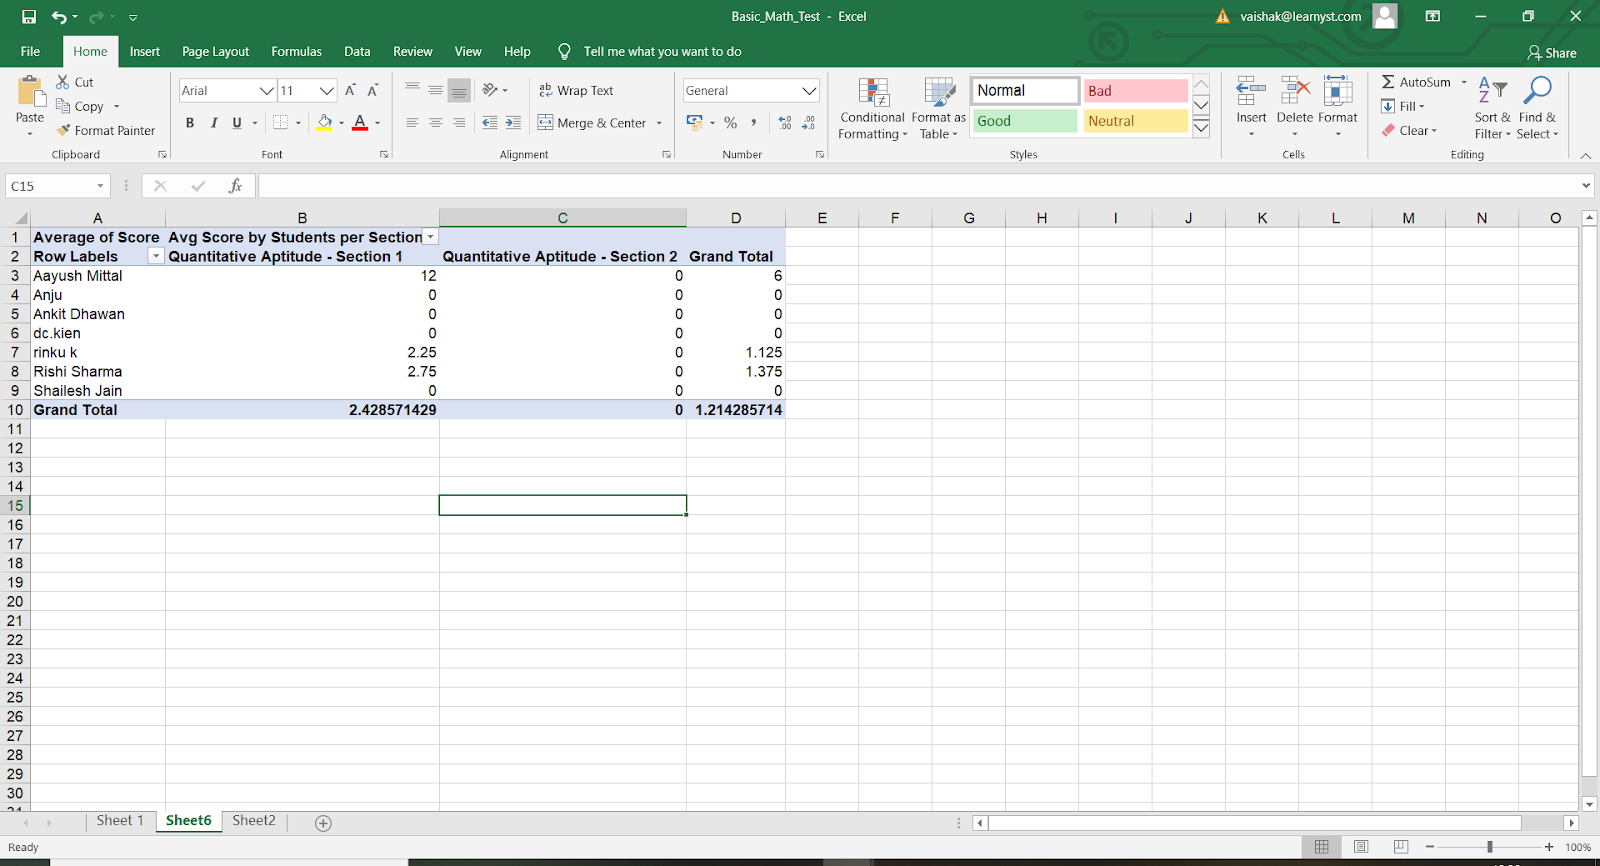
Change the Column Labels title to something like Avg Score by Students per Section.
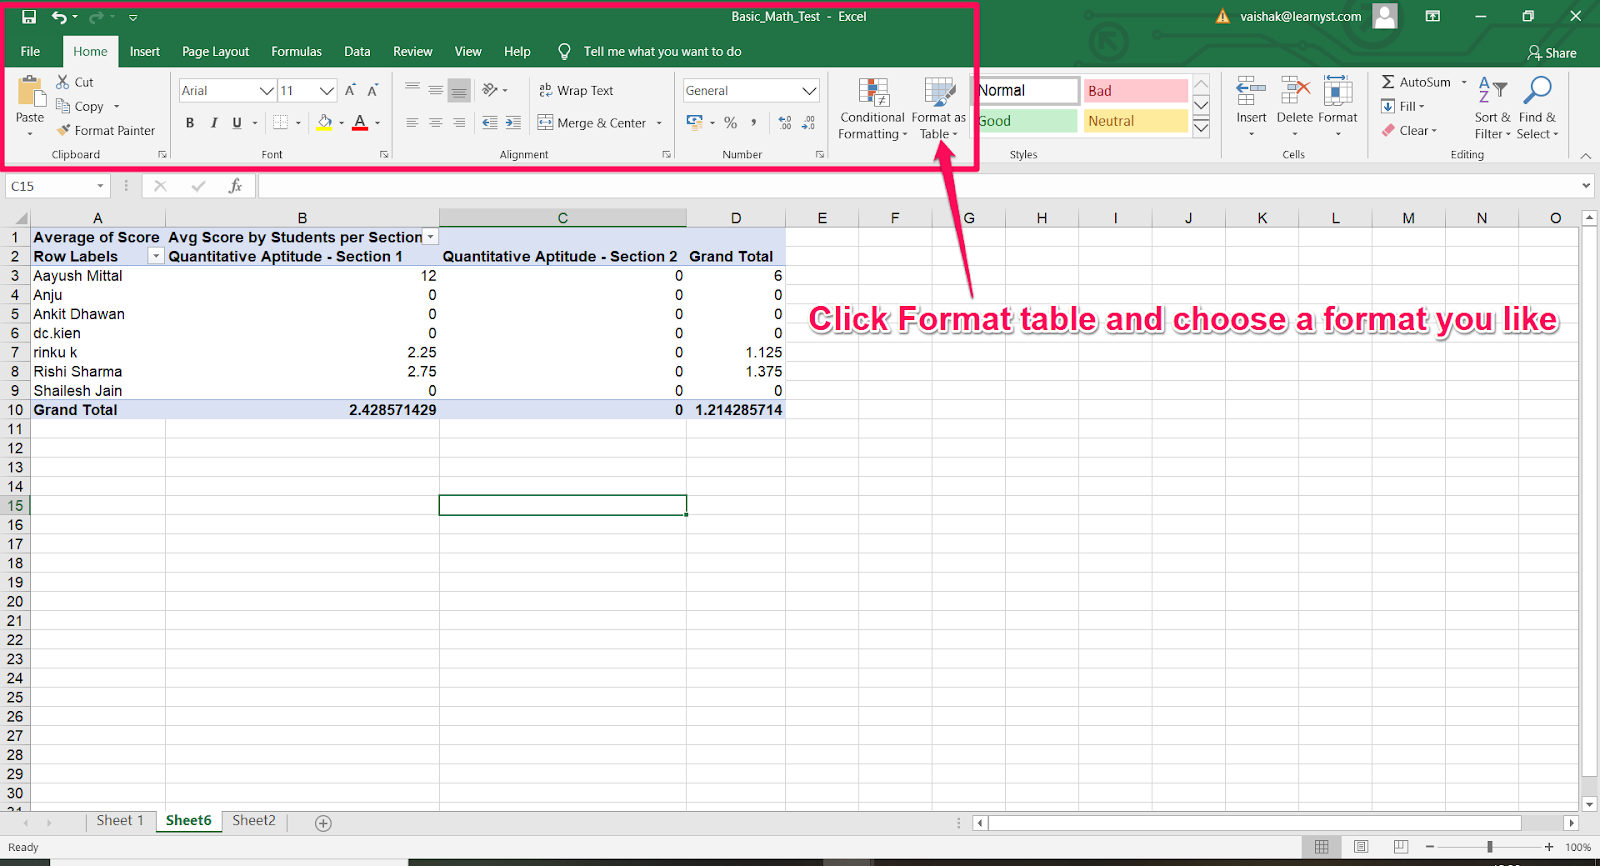
To change the look and feel of your table, go to Home. Select → Format as Table option and choose a suitable format.
Here is how my final table looks after formatting
 Did this answer your question? Thanks for the feedback There was a problem submitting your feedback. Please try again later.Yes No No results found